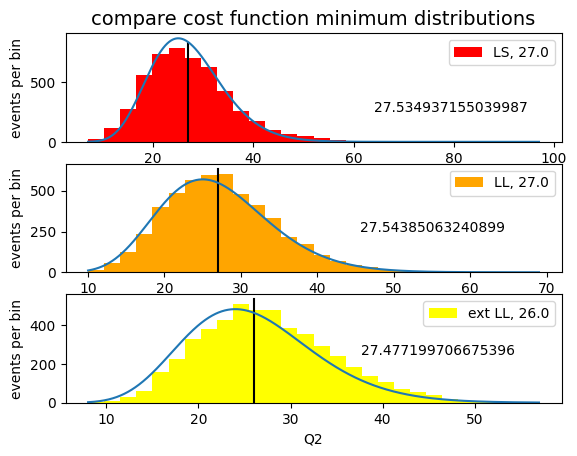
12.11. cost functions comparison: exercise 12.4#
12.11.1. Exercise 12.4#
Starting from samples of pseudo-random numbers generated
according to a Gaussian probability density function,
using the technique of the toy experiments
study the distribution of the minimum of the cost function
used by iminuit in Gaussian fits.
Does it match a \(\chi^2\) distribution for any number of events, for the cases of maximum likelihood, extended maximum likelihood, and least squares?
from matplotlib import pyplot as plt
import numpy as np
from myrand import generate_TCL_ms
from iminuit import Minuit
from scipy.stats import norm
from math import floor, ceil, sqrt

# for the binning choice
def sturges (N) :
    return floor (1 + np.log2 (N))

# parameters valid for all tests
N_toys = 5000
sample_size = 500
bins = sturges (sample_size)
12.11.1.1. binned likelihood#
from iminuit.cost import BinnedNLL

def mod_signal_bin_LL (bin_edges, mu, sigma) :
    ''' fitting model for binned likelihood'''
    return norm.cdf (bin_edges, mu, sigma)

means_bin_LL = []
sigmas_bin_LL = []
Q2_bin_LL = []
N_dof_LL = 0

for iToy in range (N_toys) :
    subsample = generate_TCL_ms (1., 0.7, sample_size)
    bin_content, bin_edges = np.histogram (subsample, bins,
                                           range = (floor (min (subsample)), ceil (max (subsample))))

    my_cost_func_bin_LL = BinnedNLL (bin_content, bin_edges, mod_signal_bin_LL)
    my_minuit_bin_LL = Minuit (
                            my_cost_func_bin_LL,
                            mu = np.mean (subsample),
                            sigma = np.std (subsample),
                           )
    my_minuit_bin_LL.limits['sigma'] = (0, None)
    my_minuit_bin_LL.migrad ()
    if not my_minuit_bin_LL.valid : continue
    means_bin_LL.append (my_minuit_bin_LL.values['mu'])
    sigmas_bin_LL.append (my_minuit_bin_LL.values['sigma'])
    Q2_bin_LL.append (my_minuit_bin_LL.fval)
    if (iToy == 0) : N_dof_LL = my_minuit_bin_LL.ndof
12.11.1.2. extended binned likelihood#
from iminuit.cost import ExtendedBinnedNLL

def mod_signal_bin_ext_LL (bin_edges, N_signal, mu, sigma) :
    ''' fitting model for extended binned likelihood'''
    return N_signal * norm.cdf (bin_edges, mu, sigma)

means_bin_ext_LL = []
sigmas_bin_ext_LL = []
Q2_bin_ext_LL = []
N_dof_ext_LL = 0

for iToy in range (N_toys) :
    subsample = generate_TCL_ms (1., 0.7, sample_size)
    bin_content, bin_edges = np.histogram (subsample, bins,
                                           range = (floor (min (subsample)), ceil (max (subsample))))

    my_cost_func_bin_ext_LL = ExtendedBinnedNLL (bin_content, bin_edges, mod_signal_bin_ext_LL)
    my_minuit_bin_ext_LL = Minuit (
                            my_cost_func_bin_ext_LL,
                            N_signal = len (subsample),
                            mu = np.mean (subsample),
                            sigma = np.std (subsample),
                           )
    my_minuit_bin_ext_LL.limits['N_signal', 'sigma'] = (0, None)
    my_minuit_bin_ext_LL.migrad ()
    if not my_minuit_bin_ext_LL.valid : continue
    means_bin_ext_LL.append (my_minuit_bin_ext_LL.values['mu'])
    sigmas_bin_ext_LL.append (my_minuit_bin_ext_LL.values['sigma'])
    Q2_bin_ext_LL.append (my_minuit_bin_ext_LL.fval)
    if (iToy == 0) : N_dof_ext_LL = my_minuit_bin_ext_LL.ndof
12.11.1.3. least squares#
from iminuit.cost import LeastSquares

def func_approx (x, N_events, mean, sigma, bin_width) :
    return N_events * norm.pdf (x, mean, sigma) * bin_width

means_LS = []
sigmas_LS = []
Q2_bin_LS = []
N_dof_LS = 0

for iToy in range (N_toys) :
    subsample = generate_TCL_ms (1., 0.7, sample_size)
    bin_content, bin_edges = np.histogram (subsample, bins,
                                           range = (floor (min (subsample)), ceil (max (subsample))))
    bin_centres = 0.5 * (bin_edges[1:] + bin_edges[:-1])
    sigma_y = [max (sqrt (num), 1.) for num in bin_content]

    least_squares = LeastSquares (bin_centres, bin_content, sigma_y, func_approx)
    my_minuit_LS = Minuit (least_squares,
                           N_events = sample_size,
                           mean = np.mean (subsample),
                           sigma = np.std (subsample),
                           bin_width = bin_centres[1] - bin_centres[0]
                          )
    my_minuit_LS.fixed["bin_width", "N_events"] = True
    my_minuit_LS.migrad ()
    my_minuit_LS.hesse ()
    if not my_minuit_LS.valid : continue
    means_LS.append (my_minuit_LS.values['mean'])
    sigmas_LS.append (my_minuit_LS.values['sigma'])
    Q2_bin_LS.append (my_minuit_LS.fval)
    if (iToy == 0) : N_dof_LS = my_minuit_LS.ndof
---------------------------------------------------------------------------
KeyboardInterrupt                         Traceback (most recent call last)
Cell In[4], line 29
     27 my_minuit_LS.hesse ()
     28 if not my_minuit_LS.valid : continue
---> 29 means_LS.append (my_minuit_LS.values['mean'])
     30 sigmas_LS.append (my_minuit_LS.values['sigma'])
     31 Q2_bin_LS.append (my_minuit_LS.fval)

File /opt/hostedtoolcache/Python/3.10.22/x64/lib/python3.10/site-packages/iminuit/util.py:115, in BasicView.__getitem__(self, key)
    105 """
    106 Get values of the view.
    107
   (...)
    112     If it is a slice, list of int or str, return the corresponding subset.
    113 """
    114 index = _key2index(self._minuit._var2pos, key)
--> 115 if isinstance(index, list):
    116     return [self._get(i) for i in index]
    117 return self._get(index)

KeyboardInterrupt:
12.11.1.4. compare the five estimates#
from scipy.stats import chi2

def plot_histo (ax, sample, ndof, label, color) :
    xMin = floor (min (sample))
    xMax = ceil (max (sample))
    N_bins = sturges (len (sample))
    bin_edges = np.linspace (xMin, xMax, N_bins)
    ax.set_xlabel ('Q2')
    ax.set_ylabel ('events per bin')
    ax.hist (sample,
             bins = bin_edges,
             color = color,
             label = label + ', ' + str (ndof),
            )
    vertical_limits = ax.get_ylim ()
    ax.plot ([ndof, ndof], vertical_limits, color = 'black')
    ax.legend ()

    x = np.arange (xMin, xMax, 0.001)
    bin_width = (xMax - xMin) / N_bins
    ax.plot (x, bin_width * len (sample) * chi2.pdf (x, df=ndof))
    ax.text (0.66 * xMax, len (sample) / 20., str (sum (sample) / len (sample)))


fig, axes = plt.subplots (nrows = 3, ncols = 1)
axes[0].set_title ('compare cost function minimum distributions', size=14)

plot_histo (axes[0], Q2_bin_LS, N_dof_LS, 'LS', 'red')
plot_histo (axes[1], Q2_bin_LL, N_dof_LL, 'LL', 'orange')
plot_histo (axes[2], Q2_bin_ext_LL, N_dof_ext_LL, 'ext LL', 'yellow')