9.11. Likelihood exercise solutions#
9.11.1. Exercise 9.1#
Write a program that generates pseudo-random numbers distributed according to an exponential function and stores them in a list.
from myrand import generate_exp

tau   = 2.
N_evt = 800

sample = generate_exp (tau, N_evt)
9.11.2. Exercise 9.2#
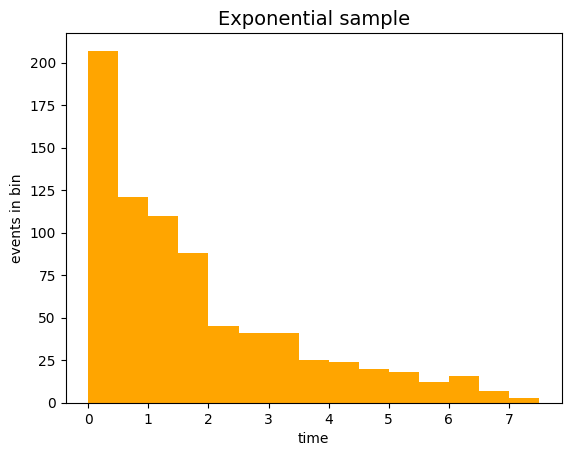
Add to the previous program the source code that fills a histogram with the numbers present in the list where they have been transferred, and displays the histogram on the screen.
import numpy as np
import matplotlib.pyplot as plt

xMin = 0.                                    # minimum of the histogram drawing range
xMax = 4. * tau                              # maximum of the histogram drawing range
bin_edges = np.arange (xMin, xMax, tau/4.)   # edges o the histogram bins

# disegno della funzione
fig, ax = plt.subplots ()
ax.set_title ('Exponential sample', size=14)
ax.set_xlabel('time')
ax.set_ylabel('events in bin')
ax.hist (sample,
         bins = bin_edges,
         color = 'orange',
        )
plt.show ()

9.11.3. Exercise 9.3#
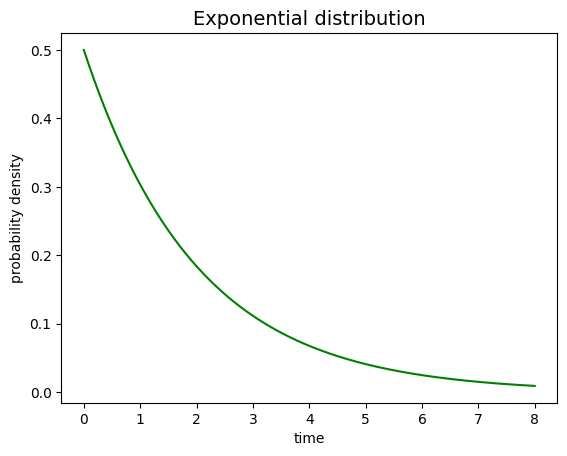
Write a program that plots the exponential probability distribution with a fixed parameter t0.
from likelihood import exp_pdf

fig, ax = plt.subplots ()
ax.set_title ('Exponential distribution', size=14)
ax.set_xlabel ('time')
ax.set_ylabel ('probability density')

x = np.linspace (xMin, xMax, 10000)
y = np.arange (0., x.size)
for i in range (x.size):
  y[i] = exp_pdf (x[i], tau)
plt.plot (x, y, 'g')
plt.show()

9.11.4. Exercise 9.4#
Write a function likelihood that calculates the likelihood
as the parameter t0 varies,
for a sample of pseudo-random events generated according to the instructions of Exercise 1.
How does the result depend on the number of events in the sample?
from likelihood import likelihood

fig, ax = plt.subplots ()
ax.set_title ('likelihood scan', size=14)
ax.set_xlabel ('tau')
ax.set_ylabel ('likelihood')

tau = np.linspace (0.5, 5., 10000)
lik = np.arange (0., tau.size)

for i in range (tau.size) :
    lik[i] = likelihood (tau[i], exp_pdf, sample[])

plt.plot (tau, lik, 'b')  #'b' indicates is the blue color
plt.show ()
  Cell In[4], line 12
    lik[i] = likelihood (tau[i], exp_pdf, sample[])
                                                 ^
SyntaxError: invalid syntax
9.11.5. Exercise 9.5#
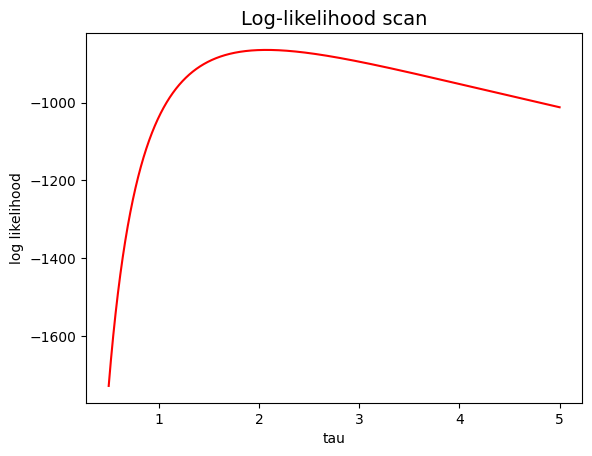
Write a function loglikelihood that calculates the logarithm of the likelihood
as the parameter t0 varies,
for a sample of pseudo-random events generated according to the instructions of Exercise 1.
Remember that the logarithm of the likelihood is defined
only when the likelihood is strictly positive.
from likelihood import loglikelihood

fig, ax = plt.subplots ()
ax.set_title ('Log-likelihood scan', size=14)
ax.set_xlabel ('tau')
ax.set_ylabel ('log likelihood')

tau = np.linspace (0.5, 5., 10000)
ll  = np.arange (0., tau.size)

for i in range (tau.size) :
    ll[i] = loglikelihood (tau[i], exp_pdf, sample)

plt.plot (tau, ll, 'r')
plt.show ()

9.11.6. Exercise 9.6#
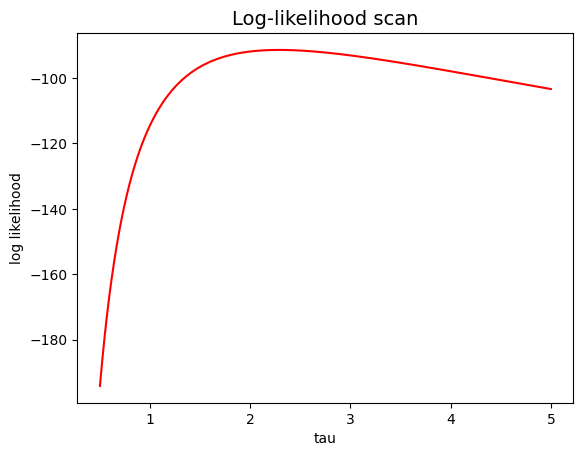
Study the behavior of the shape of the log-likelihood as a function of the number of events comprising the generated sample.
# reducing by a factor 10 the initial sample
subsample = sample[:int (len (sample)/10)]

fig, ax = plt.subplots ()
ax.set_title ('Log-likelihood scan', size=14)
ax.set_xlabel ('tau')
ax.set_ylabel ('log likelihood')

ll_1 = np.arange (0., tau.size)
for i in range (tau.size) :
    ll_1[i] = loglikelihood (tau[i], exp_pdf, subsample)

plt.plot (tau, ll_1, 'r')
plt.show ()

