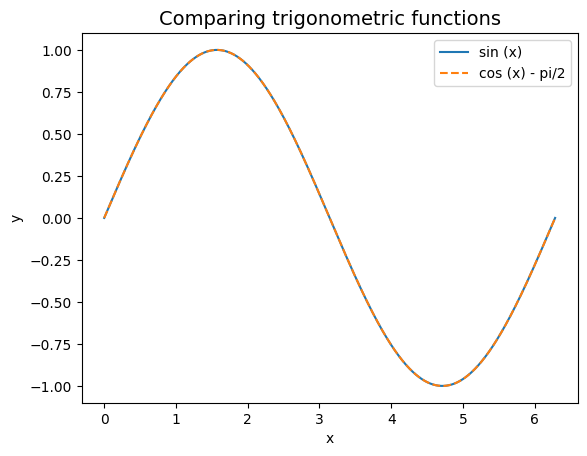
9.8. Drawing of a function#
example on the use of matplotlib.pyplot
to draw a function
def func (x) :
    return np.cos (x - np.pi / 2.)
import matplotlib.pyplot as plt
import numpy as np

fig, ax = plt.subplots (nrows = 1, ncols = 1)

# preparing the set of points to be drawn
x_coord = np.linspace (0, 2 * np.pi, 10000)
y_coord_1 = np.sin (x_coord)

y_coord_2 = np.arange (0., x_coord.size)
for i in range (x_coord.size):
    y_coord_2[i] = func (x_coord[i])

# visualisation of the image
ax.plot (x_coord, y_coord_1, label='sin (x)')
ax.plot (x_coord, y_coord_2, linestyle = 'dashed', label='cos (x) - pi/2')
ax.set_title ('Comparing trigonometric functions', size=14)
ax.set_xlabel ('x')
ax.set_ylabel ('y')
ax.legend ()

plt.show ()